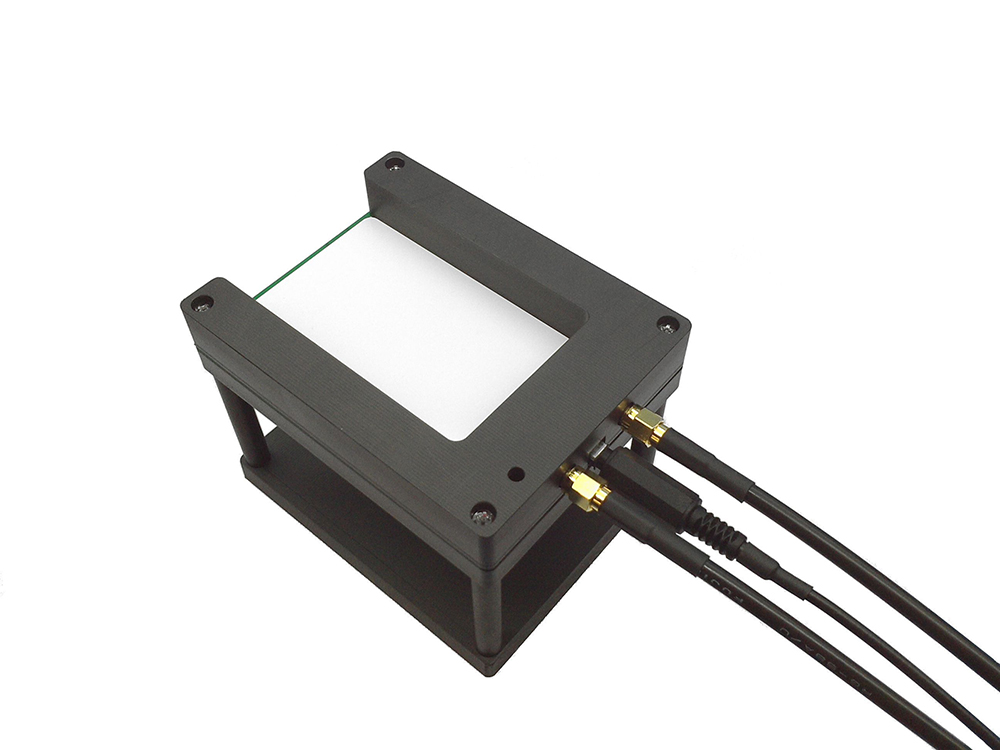
Fig. 1 Antenna for both resonance frequency inspection and communication inspection (sold separately)
Wiring
Transparency characteristics and communication inspection
(1) Connect the HF output terminal of the main unit and the transmitting terminal of the antenna with a coaxial cable.
(2) Connect the input terminal of the main unit and the receiving terminal of the antenna with a coaxial cable.
(3) Main unit Connect the control terminal of this unit and the control terminal of the antenna with the attached cable (3.5 mm plug).
* Please note that the SMA terminal of the inspection probe has a distinction between the input side and the output side.
Fig. 2 Wiring method (resonance characteristic inspection by transmission)
Reflection characteristics and communication inspection
(1) Connect the HF output terminal of the main unit and the transmitting terminal of the antenna with a coaxial cable.
(2) Connect the input terminal of the main unit and the receiving terminal of the antenna with a coaxial cable.
(3) Connect the control terminal of the main unit and the control terminal of the antenna with the attached cable (3.5 mm plug).
* Please note that the SMA terminal of the inspection probe has a distinction between the input side and the output side.
Fig. 3 Wiring method (resonance characteristic inspection by reflection)
Inspection software settings
In the inspection software settings, you can select the power (Normal Power / Low Power) during communication, enable / disable the communication function, and select the communication protocol.
(1) Select [System Settings / Maintenance] from the top menu.
(2) Select "Normal Power" for "Power setting for communication function" in the [System setting / maintenance] menu. Click the [Close] button to close this screen.
(3) Select [Category file settings] from the top menu.
(4) Check "Communication function enabled" on the "Judgment" tab and select "Card / Tag Type". If you want to make a PASS / FAIL judgment depending on whether the ID can be read, check "Pass / Fail Judgment".
(5) Click the [Finish Settings] button to close this screen.
Figure 4 Inspection software settings
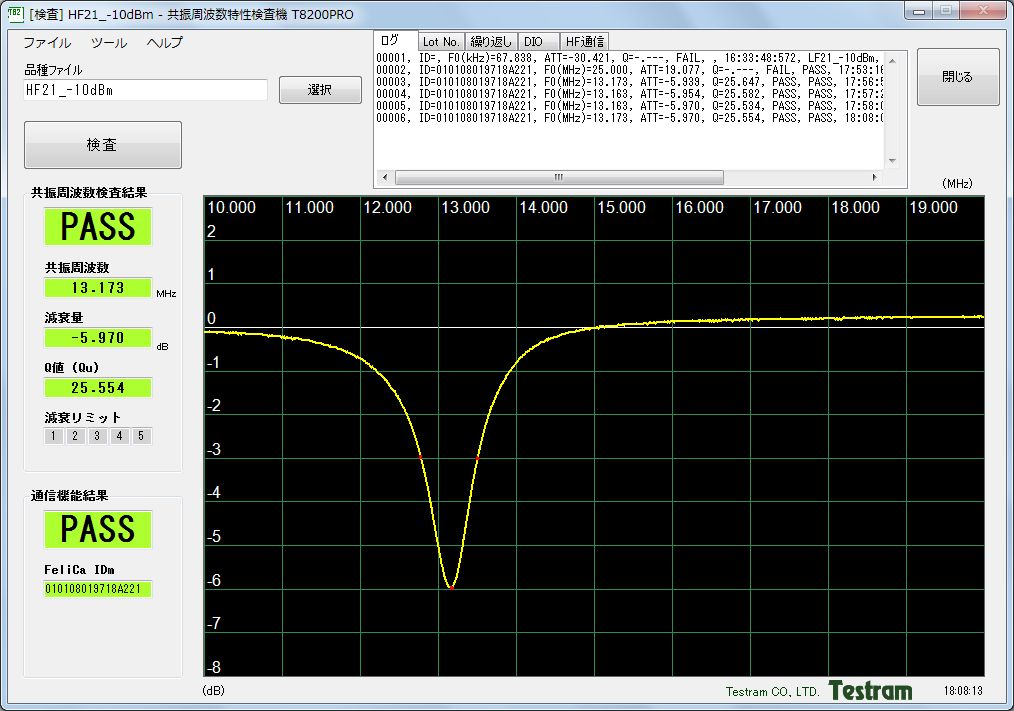
Inspection results
The communication result is displayed below the resonance frequency (lower right of the screen).
If communication does not work
If the ID cannot be read by communication
・ Is the wiring wrong?
-Is the protocol setting incorrect?
Please confirm. Communication may not be possible depending on the electrical characteristics of the inspection card and the distance between the antenna and the card. In that case, try settings 2 to 4 in Table 1.
table 1
Control terminal cable
System setting / maintenance Power setting for communication function
Setting 1 (standard setting)
Connecting
Normal Power
Setting 2
Not connect
Normal Power
Setting 3
Connecting
Low Power
Setting 4
Not connect
Low Power
[T8200PRO] Comparison of measurement results of resonance characteristics due to transmission and re
The T8200PRO is a device that inspects the resonance characteristics by placing a non-contact IC card on the inspection probe as shown in Fig. 1, and can inspect the resonance characteristics by transmission (S21) or reflection (S11). is. Here, we will explain the results obtained by measuring the transmission characteristics and reflection characteristics using the same inspection probe and IC card.
Figure 1 Inspection probe
Measurement principle
First, I will explain the measurement principle of the transmission characteristics and reflection characteristics of the T8200PRO. Figure 2 shows the equivalent circuit when a non-contact IC card is placed on the inspection probe. The inspection probe (loop antenna) is represented as an inductance L1, and the non-contact IC card is represented as a parallel resonant circuit consisting of L0, C1, and R0. Since L1 and L0 are magnetically coupled, they operate as a transformer.
Transmission characteristics: Fig. 2 (a)
For transmission characteristics, a probe for inspection is connected in series to the signal path, a sine wave is applied, and the amplitude of the transmitted wave voltage that has passed through the measurement target is measured.
When the IC card resonates, the voltage drop at the L1 part increases and the transmitted wave decreases.
The amount of attenuation at the resonance frequency depends on the loss R0 of the IC card. The larger R0, the greater the attenuation.
Reflection characteristics: Fig. 2 (b)
For the reflection characteristics, connect the T8200PRO and the inspection probe with a single coaxial cable (short the unused connector of the inspection probe), apply a sine wave, and measure the amplitude of the reflected wave voltage generated by the measurement target. ..
When the IC card resonates, the energy of the incident wave is consumed by the IC card, so the reflected wave decreases.
The amount of attenuation at the resonance frequency decreases so much that the measurement target matches 50Ω.
Table 1 Comparison of measurement results of transmission characteristics and reflection characteristics
Transmission characteristics (S21)
Reflection characteristics (S11)
Resonance frequency
13.234 MHz
13.424 MHz
Attenuation amount
−6.0dB
−10.0dB
Load Q (QL)
18.9
9.6
No load Q (Qu)
26.7
25.18
The following can be seen from Table 1.
The resonance frequency obtained from the reflection characteristics is about 200 to 300 kHz higher than the resonance frequency obtained from the transmission characteristics.
The no-load Q obtained from the reflection characteristics and the no-load Q obtained from the transmission characteristics are about the same.
Fig. 3 Resonance characteristic inspection result by transmission
Fig. 4 Resonance characteristic inspection result by reflection
Resonance frequency
The reasons why the resonance frequency due to transmission and the resonance frequency due to reflection are different are as follows. Figure 5 shows the equivalent circuit drawn using an ideal transformer for each measurement method. RS and RL are signal source resistances (both 50Ω), and k is the coupling coefficient.
Transparency characteristics
In the transmission characteristics of Fig. 5 (a), when the IC card parts (L0, C0) resonate in parallel, the current i flowing through the circuit takes a minimum value. Therefore, the resonance frequency obtained by this measurement method is almost the resonance frequency of the IC card alone 1 / 2π√ (L0C0).
Reflection characteristics
On the other hand, regarding the reflection characteristics in Fig. 5 (b), since there is a leak inductance (1−k2) L1, impedance matching is performed because the entire circuit is inductive at the resonance frequency 1 / 2π√ (L0C0) of the IC card alone. However, it matches when the L0, C0, and R0 parts become slightly capacitive at frequencies slightly higher than that. In other words, it resonates at a frequency slightly higher (about 200 to 300 kHz) than in the case of transmission characteristics.
Fig. 5 Equivalent circuit of transmission characteristics and reflection characteristics
Q value
The load Q (QL) is calculated by the following formula.
Bandwidth BW should be such that the power consumed in the resonant circuit is half the peak value (the voltage drops by 3 dB). For the transmission characteristics (Fig. 3), the bandwidth is the level at which the attenuation is increased by 3 dB from the minimum value. For reflection characteristics (Figure 4), the bandwidth is the level that is 3 dB lower than the total reflection level (0 dB).
Since the load Q (QL) is the Q of the entire measurement system including the drive circuit and receiver circuit in addition to the measurement target and antenna (probe) (Q in Fig. 5 as a whole), the load Q and reflection characteristics obtained from the transmission characteristics The load Q obtained from can not be simply compared because the degree of influence of the drive circuit and the receiver circuit is different.
No-load Q (Qu) is the Q of the antenna (probe) part of the measurement target (Q of the dotted line part in Fig. 5). The no-load Q obtained from the transmission characteristics and the no-load Q obtained from the reflection characteristics are about the same value.
Conclusion
The results can be summarized as follows.
The resonance frequency obtained from the reflection characteristics is about 200 to 300 kHz higher than the resonance frequency obtained from the transmission characteristics (however, this deviation depends on the degree of magnetic field coupling). The resonance frequency obtained from the transmission characteristics is close to the parallel resonance frequency of the IC card alone. The resonance frequency obtained from the reflection characteristics is the frequency when the entire circuit is impedance-matched and the power is transmitted to the maximum, which is higher than the parallel resonance frequency of the IC card alone.
The no-load Q obtained from the reflection characteristics and the no-load Q obtained from the transmission characteristics are about the same value.
* However, it may not be possible to measure accurately depending on the measurement target. Please refer to the following for which inspection method to choose.
When the transmission characteristics are advantageous
IC module unmounted tag.
When the magnetic field coupling between the measurement target and the antenna (probe) is strong.
When the reflection characteristics are advantageous
When multiple resonance points are created due to the influence of leakage inductance and it is not possible to measure well with the transmission characteristics.
When the measurement target and the antenna (probe) are far apart, and the attenuation is small due to the transmission characteristics, making accurate measurement impossible.
Q (quality factor) is an index that expresses the "goodness" of a resonant circuit, but the T8200PRO can inspect loaded Q (loaded Q) or unloaded Q (unloaded Q).
What are Loaded Q and Unloaded Q?
Figure 1 Load Q and No Load Q
Load Q (QL, loaded Q)
It refers to the Q of the entire measurement system including the measurement object, the measurement antenna (probe), the output resistance of the drive circuit, and the input resistance of the reception circuit (see Fig. 1).
Calculated as "load Q = resonant frequency / bandwidth" (see Figures 2 and 3). Bandwidth BW is 3 dB from the resonance point for transmission (S21) and -3 dB for total internal reflection (0 dB) for reflection (S11).
When the amount of attenuation is large (about 12 dB or more for S21, about 25 dB or more for S11), the influence of the drive circuit / receiving circuit can be ignored, and QL ≈ Qu for transmission and QL ≈ Qu / 2 for reflection. It becomes.
Unloaded Q (Qu, unloaded Q)
Refers to the Q of the measurement object and the measurement antenna (probe) (see Fig. 1). The value is close to the unique Q of the object to be measured.
No-load Q is calculated from the theoretical formula of the resonant circuit considering the signal source resistance and load resistance. The bandwidth does not necessarily have to be the "3dB position" as shown in Figures 2 and 3 (it can be set to any position).
Even if the distance between the object to be measured and the measuring antenna (probe) changes, or if the shape and number of turns of the measuring antenna change slightly, the no-load Q is not significantly affected.
Fig. 2 Resonance characteristic inspection result by transmission (load Q)
Fig. 3 Resonance characteristic inspection result by reflection (load Q)
Figure 4 Even if the tag is slightly curved, it will not be affected if it is a no-load Q.
Fig. 5 Resonance characteristic inspection result by transmission (no load Q)
Setting method
(1) Select [System Settings / Maintenance] from the top menu.
(2) Select load Q or no load Q in the "Q value calculation method" field.
When outputting no-load Q in the reflection characteristic test, specify either under-coupled (loose
■ under-coupled
Specify this when the magnetic field coupling between the measurement object and the measurement antenna (probe) is weak. If the size of the object to be measured and the size of the measuring antenna (probe) are significantly different, it corresponds to the case where the distance between the two is about several mm or more.
■ over-coupled
Specify this when the magnetic field coupling between the measurement object and the measurement antenna (probe) is strong. This applies when the object to be measured and the measuring antenna (probe) are of the same size and are in close contact with each other.
[T8200PRO] How to set resonance characteristic inspection by transmission and resonance characterist
The T8200PRO can inspect the resonance characteristics by transmission or the resonance characteristics by reflection. This page explains how to connect each inspection and how to set the inspection software.
Resonance characteristic inspection by transmission
In "transmission inspection", the sine wave signal output from the T8200PRO main unit is applied to the inspection target, and the transmitted (through) voltage is measured.
Wiring
Connect the T8200PRO main unit and the inspection probe as shown in Figure 1.
Please note that the SMA terminal of the inspection probe has a distinction between the input side and the output side.
* If you do not perform communication inspection, you do not need a cable for control terminals.
Fig. 1 Wiring method (resonance characteristic inspection by transmission)
Inspection software settings
(1) Select [Category file settings] from the top menu.
(2) Select "Through characteristics" in the LF and HF band connection modes on the [Category file settings] screen.
(3) Select "Judgment" tab, sideband width determination method "A", and set α: 3dB.* Please note that this is different from the case of reflection.
(4) Click the [Finish Settings] or [Calibrate] button to close the dialog.
Fig. 2 Inspection software setting (resonance characteristic inspection by transmission)
Resonance characteristic inspection by reflection
In "reflection inspection", the sinusoidal signal output from the T8200PRO main unit is applied to the inspection target and the reflected voltage is measured.
Wiring
Connect the T8200PRO main unit and the inspection probe as shown in Fig. 3.
Please note that the SMA terminal of the inspection probe has a distinction between the input side and the output side.
Connect the short plug to the SMA terminal of the inspection probe that is not connected to the T8200PRO.
* If you do not perform communication inspection, you do not need a cable for control terminals.
Fig. 3 Wiring method (resonance characteristic inspection by reflection)
Inspection software settings
(1) Select [Category file settings] from the top menu.
(2) Select "Reflection characteristics" in the LF and HF band connection modes on the [Category file settings] screen.
(3) Select "Judgment" tab, sideband width determination method "B", and set α: 3dB.* Please note that it is different from the case of transparency.
(4) Click the [Finish Settings] or [Calibrate] button to close the dialog.
Fig. 4 Inspection software setting (resonance characteristic inspection by reflection)